Exploring your time-series with Grafana
The InfluxDB-Grafana Plugin comes with a collection of predefined dashboards you can use to visualize the time-series stored in InfluxDB.
For a complete list of all the metrics time-series that are collected and stored in InfluxDB, see the List of metrics section of the StackLight Collector documentation.
The Main dashboard
We recommend that you start with the Main dashboard, as shown below, as an entry to other dashboards. The Main dashboard provides a single pane of glass from where you can visualize the overall health status of your OpenStack services, such as Nova, Cinder, HAProxy, MySQL, RabbitMQ, and others.

The Main dashboard, like most dashboards, provides a drop-down menu in the upper left corner from where you can pick a particular metric dimension, such as the controller name or the device name you want to select.
In the example above, the dashboard displays the system metrics of node-48.
Within the OpenStack Services section, each of the services represented can be assigned five different statuses.
Note
The precise determination of a service health status depends on the correlation policies implemented for that service by a Global Status Evaluation (GSE) plugin. See the Configuring alarms section in the StackLight Collector documentation.
The service health statuses can be as follows:
- Down: One or several primary functions of a service cluster has failed. For example, all API endpoints of a service cluster like Nova or Cinder failed.
- Critical: One or several primary functions of a service cluster are severely degraded. The quality of service delivered to the end user is severely impacted.
- Warning: One or several primary functions of a service cluster are slightly degraded. The quality of service delivered to the end user is slightly impacted.
- Unknown: There is not enough data to infer the actual health status of a service cluster.
- Okay: None of the above was found to be true.
The Virtual compute resources section provides an overview of the amount of virtual resources being used by the compute nodes including the number of virtual CPUs, the amount of memory and disk space being used, as well as the amount of virtual resources remaining available to create new instances.
The System section provides an overview of the amount of physical resources being used on the control plane (the controller cluster). You can select a specific controller using the controller’s drop-down list in the left corner of the toolbar.
The Ceph section provides an overview of the resources usage and current health status of the Ceph cluster when it is deployed in the OpenStack environment.
The Main dashboard is also an entry point to access more detailed dashboards for each of the OpenStack services that are monitored. For example, if you click the Nova box, the Nova dashboard is displayed.

The Nova dashboard
The Nova dashboard provides a detailed view of the Nova service’s related metrics and consists of the following sections:
Service status – information about the Nova service cluster overall health status, including the status of the API front end (the HAProxy public VIP), a counter of HTTP 5xx errors, the HTTP requests response time and status code.
Nova API – information about the current health status of the API back ends, for example, nova-api, ec2-api, and others.
Nova services – information about the current and historical status of the Nova workers.
Instances – information about the number of active instances in error and instances creation time statistics.
Resources – various virtual resources usage indicators.
Self-monitoring dashboards
The Self-Monitoring dashboard brings operational insights about the overall monitoring system (the toolchain) performance. It provides information about the hekad and collectd processes. In particular, the Self-Monitoring dashboard provides information about the amount of system resources consumed by these processes, the time allocated to the Lua plugins running within hekad, the number of messages being processed, and the time it takes to process those messages.
You can select a particular node view using the drop-down menu.
Since StackLight 0.9, there are two new dashboards:
- The Elasticsearch Cluster dashboard provides information about the overall health status of the Elasticsearch cluster including the state of the shards, the number of pending tasks, and various resources usage metrics.
- The InfluxDB Cluster dashboard provides statistics about the InfluxDB processes running in the InfluxDB cluster including various resources usage metrics.
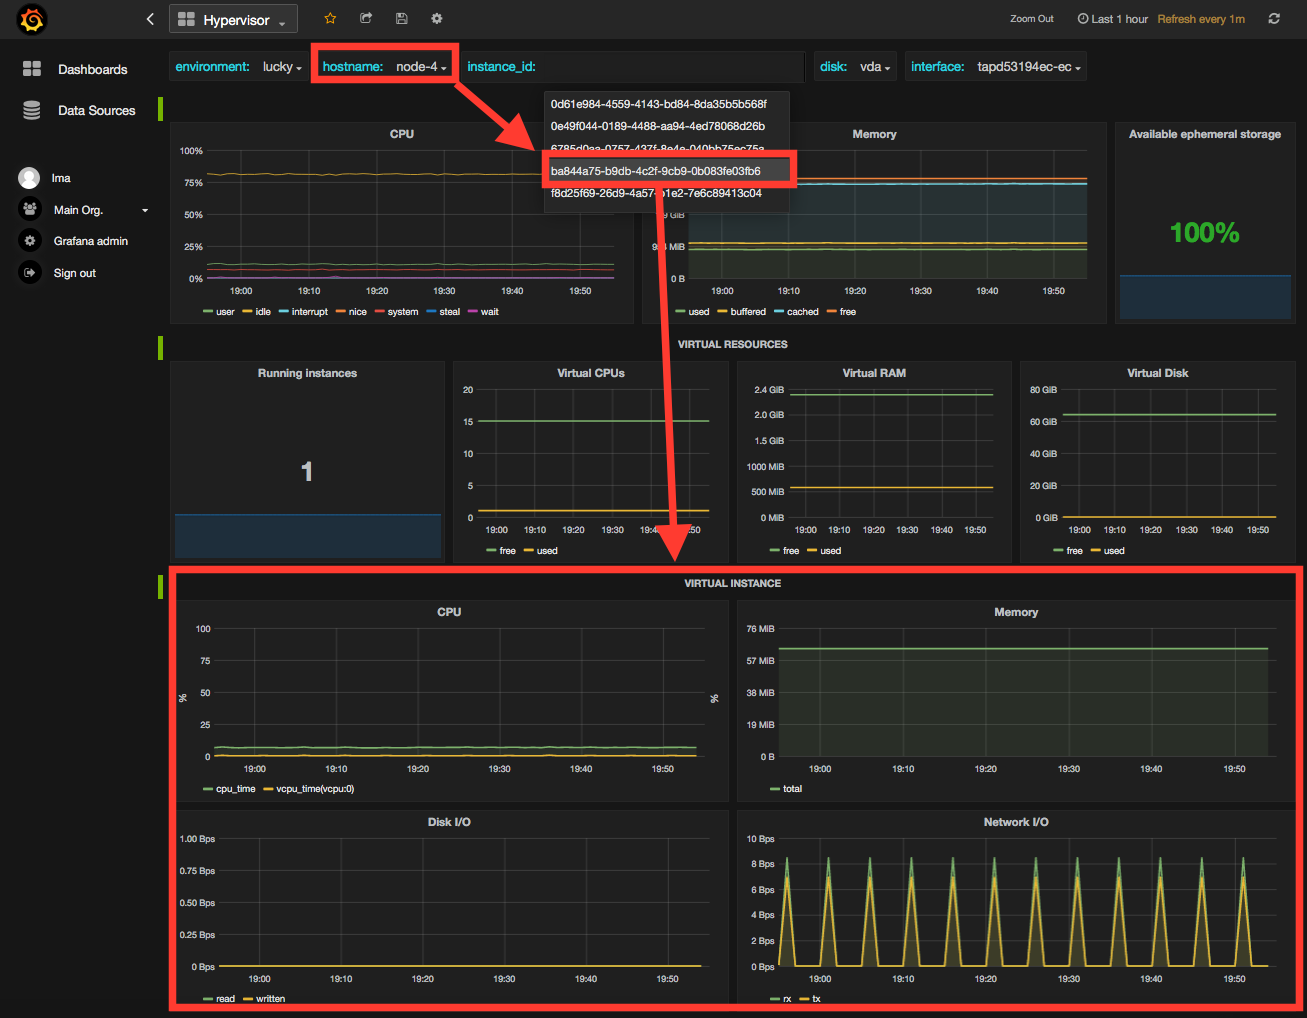
The hypervisor dashboard
The Hypervisor dashboard brings operational insights about the virtual
instances managed through libvirt. As shown in the figure below, the
Hypervisor dashboard assembles a view of various libvirt metrics. Use
the drop-down menu to pick a particular instance UUID running on a particular
node. The example below shows the metrics for the instance ID
ba844a75-b9db-4c2f-9cb9-0b083fe03fb7 running on node-4.
For additional information on the libvirt metrics that are displayed in the Hypervisor dashboard, see the List of metrics section of the StackLight Collector documentation.
Other dashboards
There are 19 different dashboards in total that you can use to explore different time-series facets of your OpenStack environment.
Viewing faults and anomalies
The LMA Toolchain is capable of detecting a number of service-affecting conditions, such as the faults and anomalies that occurred in your OpenStack environment. These conditions are reported in annotations that are displayed in Grafana. The Grafana annotations contain a textual representation of the alarm (or set of alarms) that were triggered by the Collectors for a service. In other words, the annotations contain valuable insights that you can use to diagnose and troubleshoot issues. Furthermore, with the Grafana annotations, the system makes a distinction between what is estimated as a direct root cause versus what is estimated as an indirect root cause. This is internally represented in a dependency graph. There are first degree dependencies used to describe situations, whereby the health status of an entity strictly depends on the health status of another entity. For example, Nova as a service has first-degree dependencies with the nova-api endpoints and the nova-scheduler workers. But there are also second-degree dependencies, whereby the health status of an entity does not strictly depend on the health status of another entity, although it might, depending on other operations being performed. For example, by default, we declared that Nova has a second-degree dependency with Neutron. As a result, the health status of Nova will not be directly impacted by the health status of Neutron, but the annotation will provide a root cause analysis hint. Consider a situation where Nova has changed from okay to the critical status (because of 5xx HTTP errors) and that Neutron has been in the down status for a while. In this case, the Nova dashboard will display an annotation showing that Nova has changed to a warning status because the system has detected 5xx errors and that it may be due to the fact that Neutron is down. Below is an example of an annotation, which shows that the health status of Nova is down because there is no nova-api service back end (viewed from HAProxy) that is up.

Hiding nodes from dashboards
When you remove a node from the environment, it is still displayed in the server and controller drop-down lists. To hide it from the list, edit the associated InfluxDB query in the Templating section. For example, if you want to remove node-1, add the following condition to the where clause:
and hostname != 'node-1'

To hide more than one node, add more conditions. For example:
and hostname != 'node-1' and hostname != 'node-2'
Perform these actions for all dashboards that display the deleted node and save them afterward.